SCREENSHOTS:
Click to view full screen ...
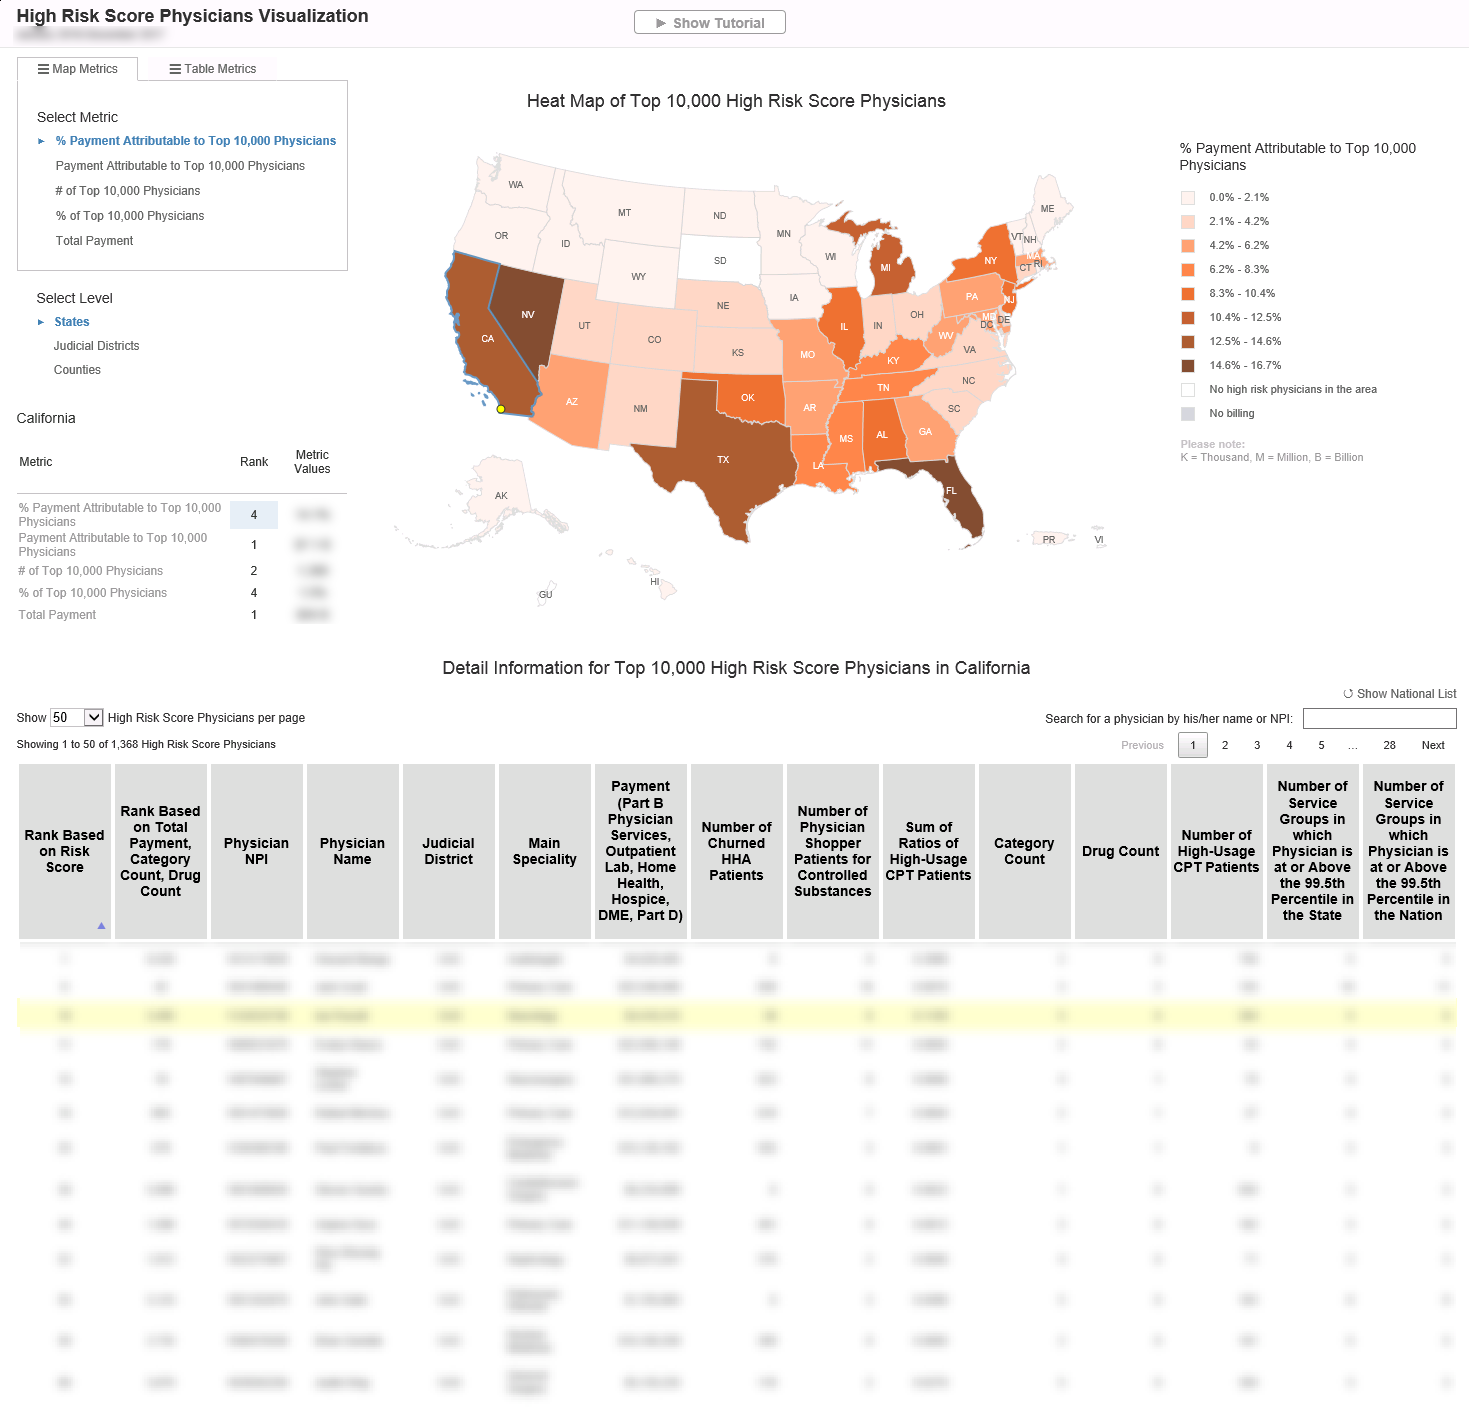
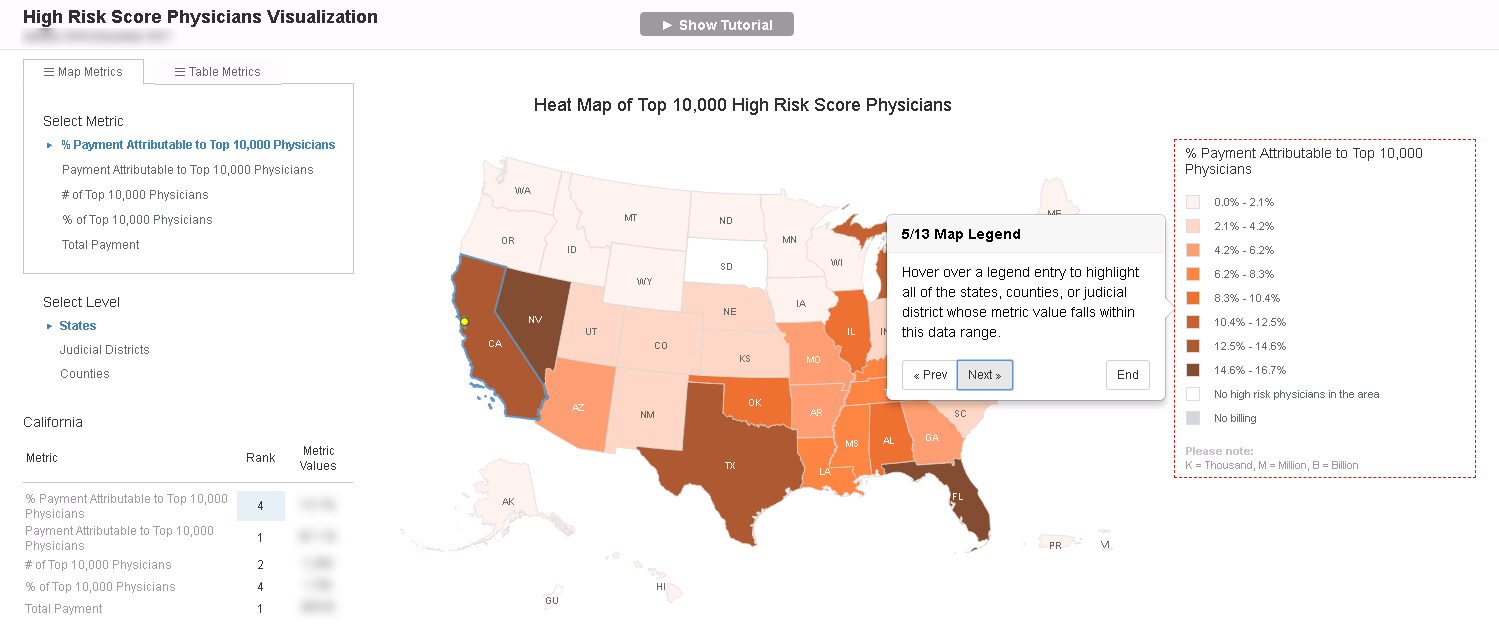
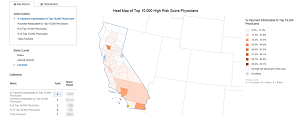
The final tool with the map view.
It contains two views:
It contains two views:
- Map View - default view
- Table View - containing controls to toggle the table columns
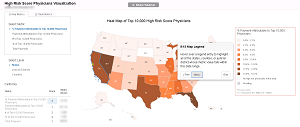
- Provide a visual representation of ranks of regions based on various metrics
- Act as a controller to filter the table of physician information.
Click to view full screen ...
The Table metrics view has a list of all the columns in the table and can be used to toggle the visibility of these columns.
All the columns highlighted in blue are visible in the table.
Users can also toggle visibility of a group of columns.
Click to view full screen ...
Click to view full screen ...
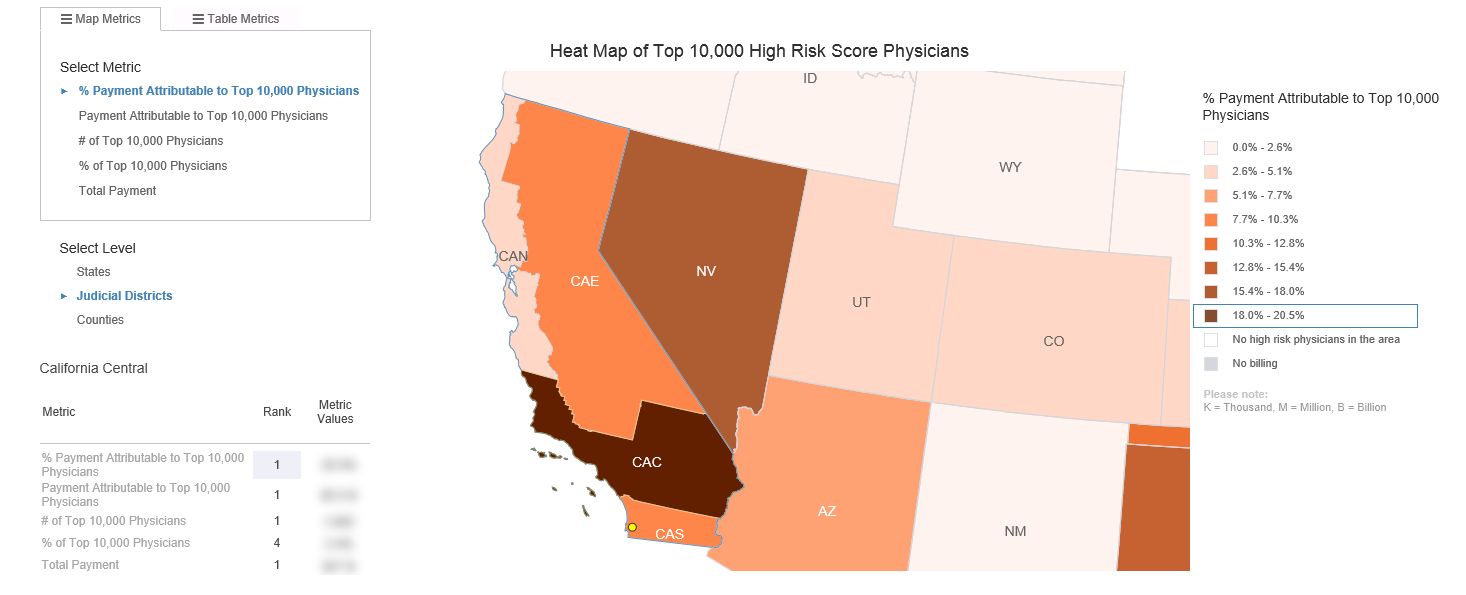
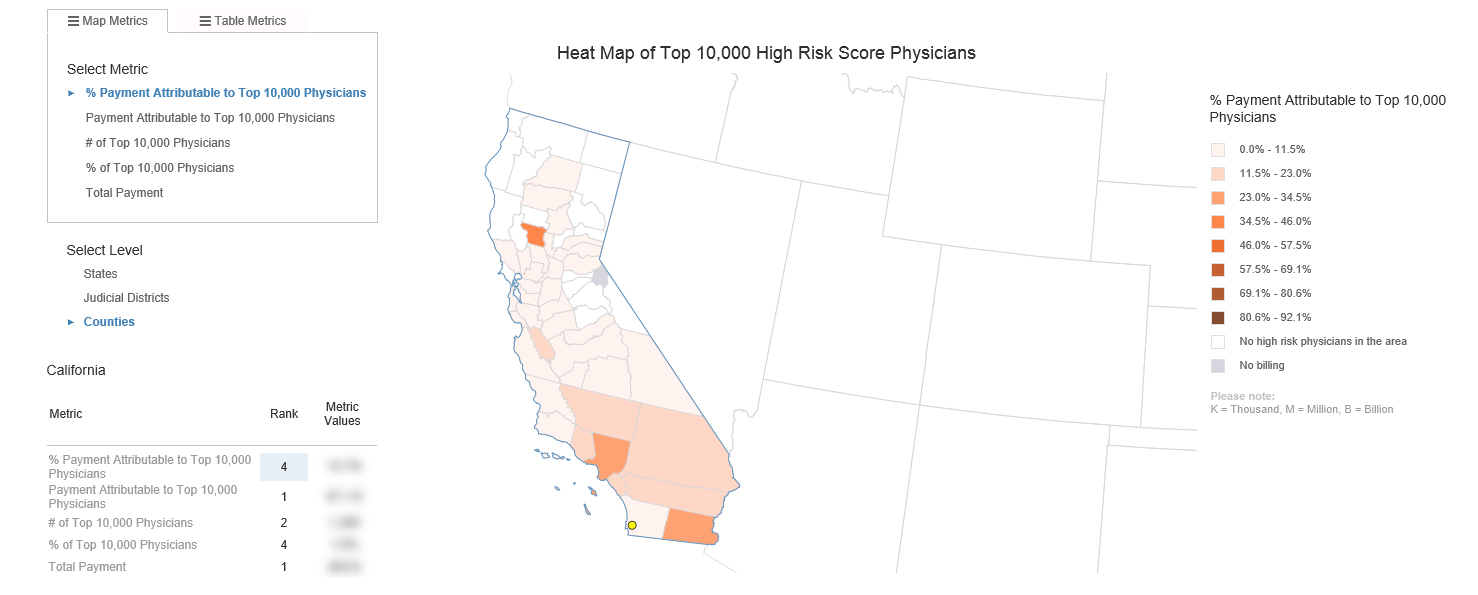
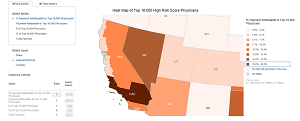
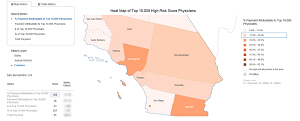
I implemented mouse wheel map zooming and translation for a smooth interactive experience for users.
Users can zoom into the map to view the judicial districts and the counties.
Click to view full screen ...
Click to view full screen ...
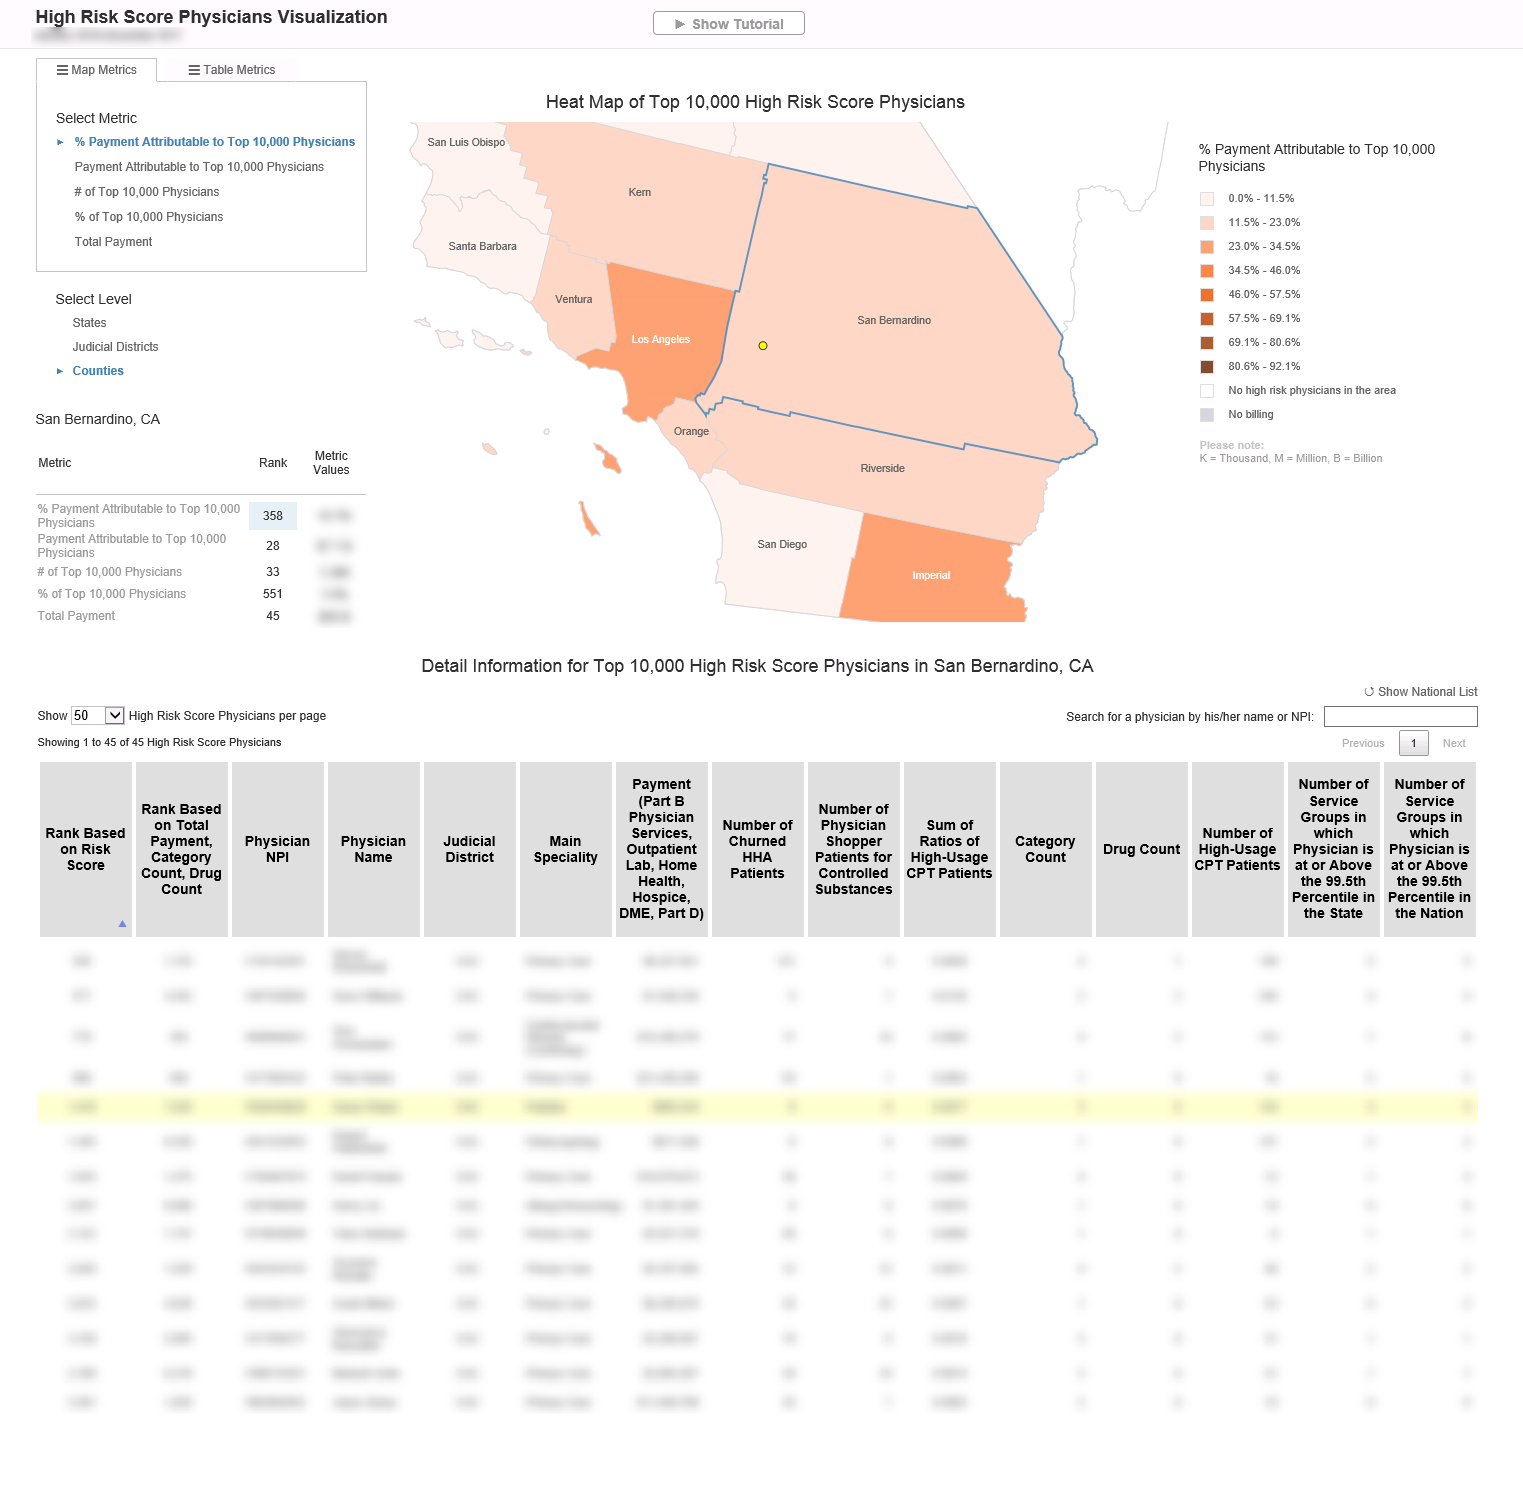
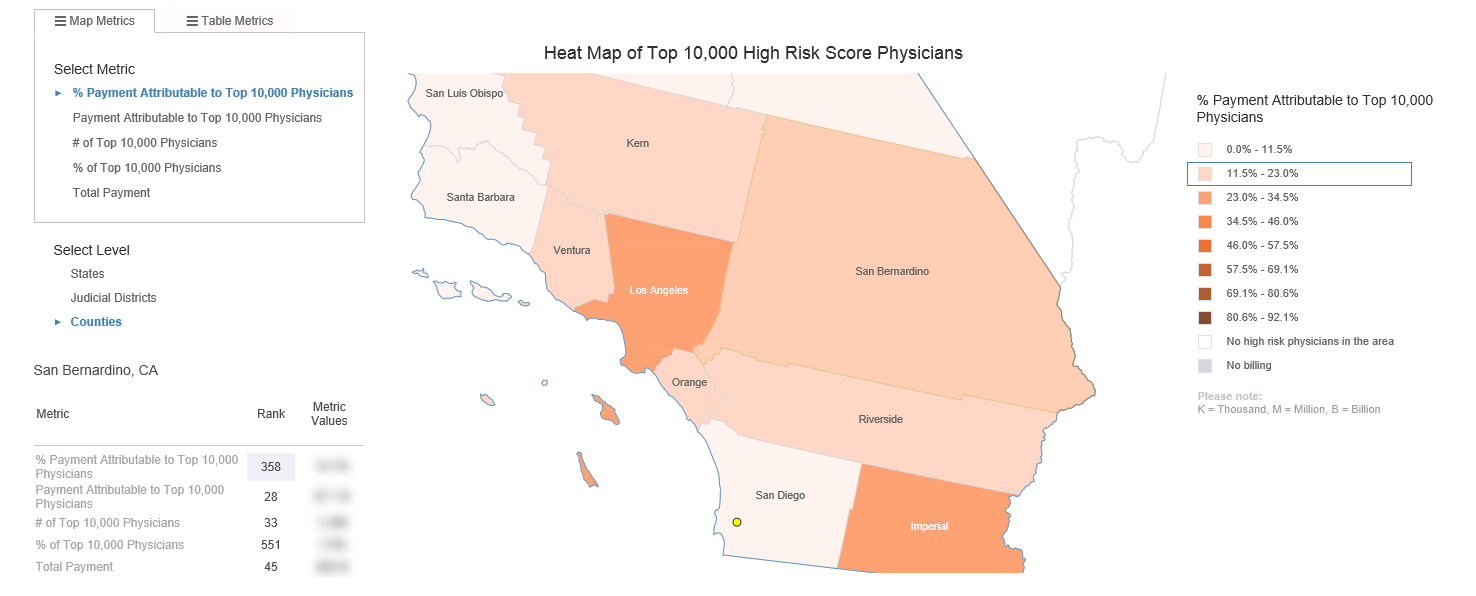
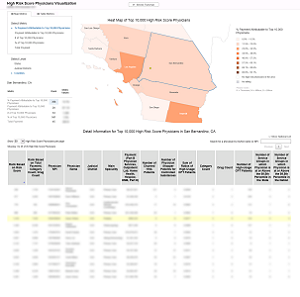
Clicking on a state, judicial district or county filters the table for the clicked region.
If the user wants to check the location of the physician, they can click on the physician row on the table to add a yellow marker on the map which indicates the actual geographic location of the selected physician.
Click to view full screen ...
An example of using bootstrap tutorial for user reference.